 Web Server Statistics for urbandogmagazine.com Web Server Statistics for urbandogmagazine.com
(Go To: Top: General Summary: Daily Summary: Hourly Summary: Domain Report: Organization Report: Operating System Report: Status Code Report: File Size Report: File Type Report: Directory Report: Request Report)
This report contains overall statistics.
Successful requests: 15,071
Average successful requests per day: 15,080
Successful requests for pages: 2,138
Average successful requests for pages per day: 2,138
Failed requests: 2,090
Redirected requests: 4
Distinct files requested: 12,195
Distinct hosts served: 1,503
Corrupt logfile lines: 88
Data transferred: 712.81 megabytes
Average data transferred per day: 713.30 megabytes
(Go To: Top: General Summary: Daily Summary: Hourly Summary: Domain Report: Organization Report: Operating System Report: Status Code Report: File Size Report: File Type Report: Directory Report: Request Report)
This report lists the total activity for each day of the week, summed over all the weeks in the report.
Each unit ( ) represents 50 requests
for pages or part thereof.
) represents 50 requests
for pages or part thereof.
day: #reqs: #pages: ---: -----: ------: Sun: 0: 0: Mon: 0: 0: Tue: 0: 0: Wed: 0: 0: Thu: 0: 0: Fri: 15071: 2138:
(Go To: Top: General Summary: Daily Summary: Hourly Summary: Domain Report: Organization Report: Operating System Report: Status Code Report: File Size Report: File Type Report: Directory Report: Request Report)
This report lists the total activity for each hour of the day, summed over all the days in the report.
Each unit () represents 6 requests
for pages or part thereof.
hour: #reqs: #pages: ----: -----: ------: 0: 635: 118:1: 678: 111:
3: 613: 91:
7: 612: 110:
(Go To: Top: General Summary: Daily Summary: Hourly Summary: Domain Report: Organization Report: Operating System Report: Status Code Report: File Size Report: File Type Report: Directory Report: Request Report)
This report lists the countries of the computers which requested files.
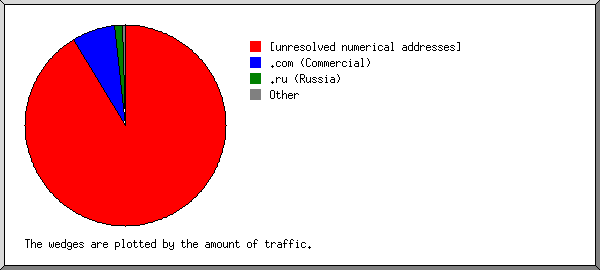
Listing domains, sorted by the amount of traffic.
#reqs: %bytes: domain
-----: ------: ------
10312: 42.52%: .com (Commercial)
 2079: 38.27%: [unresolved numerical addresses]
 1496:  8.85%: [unknown domain]
  954:  4.90%: .net (Networks)
   26:  0.97%: .ru (Russia)
   14:  0.90%: [domain not given]
   10:  0.83%: .de (Germany)
   18:  0.78%: .br (Brazil)
   10:  0.44%: .in (India)
    7:  0.32%: .es (Spain)
    7:  0.22%: .ua (Ukraine)
    2:  0.21%: .za (South Africa)
    7:  0.12%: .cl (Chile)
    5:  0.11%: .ar (Argentina)
    1:  0.11%: .il (Israel)
    1:  0.11%: .io (British Indian Ocean Territory)
   50:  0.11%: .vn (Vietnam)
    2:  0.08%: .ec (Ecuador)
   19:  0.03%: .cn (China)
    9:  0.02%: .mx (Mexico)
    6:  0.01%: .th (Thailand)
    3:  0.01%: .tr (Turkey)
    3:  0.01%: .gr (Greece)
    2:  0.01%: .arpa (Arpanet)
    2:  0.01%: .np (Nepal)
    3:  0.01%: .id (Indonesia)
    2:       : .it (Italy)
    2:       : .pl (Poland)
    1:       : .tc (Turks and Caicos Islands)
    1:       : .ca (Canada)
    1:       : .cz (Czech Republic)
    1:       : .jp (Japan)
    1:       : .jo (Jordan)
    1:       : .ae (United Arab Emirates)
    1:       : .nz (New Zealand)
    1:       : .cc (Cocos (Keeling) Islands)
    1:       : .az (Azerbaijan)
    1:       : .nl (Netherlands)
    1:       : .org (Non Profit Making Organizations)
    1:       : .uy (Uruguay)
    1:       : .gh (Ghana)
    1:       : .am (Armenia)
    1:       : .hu (Hungary)
    1:       : .md (Moldova)
    1:       : .se (Sweden)
    1:       : .bd (Bangladesh)
    1:       : .sg (Singapore)
(Go To: Top: General Summary: Daily Summary: Hourly Summary: Domain Report: Organization Report: Operating System Report: Status Code Report: File Size Report: File Type Report: Directory Report: Request Report)
This report lists the organizations of the computers which requested files.

Listing the top 20 organizations by the number of requests, sorted by the number of requests.
#reqs: %bytes: organization
-----: ------: ------------
 6760: 20.01%: semrush.com
 2718: 10.09%: petalsearch.com
 1496:  8.85%: [unknown domain]
  632:  2.06%: ip-51-222-154.net
  594:  0.73%: 77
  436:  2.33%: seranking.com
  343:  2.65%: 5
  216:  8.31%: 212.102
  177:  0.76%: 216.244
  161:  0.33%: apple.com
  149:  0.26%: ahrefs.net
  106:  0.29%: ovh.net
   53:  2.06%: 185.255
   50:  1.37%: 103
   50:  0.11%: vn
   39:  1.88%: datapacket.com
   38:  1.26%: amazonaws.com
   36:  0.09%: 141.148
   34:  0.05%: 87
   28:  1.93%: vultrusercontent.com
  955: 34.58%: [not listed: 334 organizations]
(Go To: Top: General Summary: Daily Summary: Hourly Summary: Domain Report: Organization Report: Operating System Report: Status Code Report: File Size Report: File Type Report: Directory Report: Request Report)
This report lists the operating systems used by visitors.

Listing operating systems, sorted by the number of requests for pages.
 #: #reqs: #pages: OS
--: -----: ------: --
 1:  1770:   1395: Windows
  :  1628:   1307:   Windows NT
  :   141:     88:   Unknown Windows
  :     1:      0:   Windows CE
 2:  9191:    346: OS unknown
 3:   638:    158: Macintosh
 4:   639:    122: Known robots
 5:  2822:    113: Unix
  :  2822:    113:   Linux
(Go To: Top: General Summary: Daily Summary: Hourly Summary: Domain Report: Organization Report: Operating System Report: Status Code Report: File Size Report: File Type Report: Directory Report: Request Report)
This report lists the HTTP status codes of all requests.

Listing status codes, sorted numerically.
#reqs: status code
-----: -----------
14996: 200 OK
    1: 206 Partial content
    4: 302 Document found elsewhere
   74: 304 Not modified since last retrieval
    1: 403 Access forbidden
 2085: 404 Document not found
    4: 500 Internal server error
(Go To: Top: General Summary: Daily Summary: Hourly Summary: Domain Report: Organization Report: Operating System Report: Status Code Report: File Size Report: File Type Report: Directory Report: Request Report)
This report lists the sizes of files.

       size: #reqs: %bytes:
-----------: -----: ------:
          0:    79:       :
   1B-  10B:     0:       :
  11B- 100B:     1:       :
 101B-  1kB:   197:  0.01%:
  1kB- 10kB:    85:  0.08%:
 10kB-100kB: 14120: 39.30%:
100kB-  1MB:   587: 60.14%:
  1MB- 10MB:     2:  0.47%:
(Go To: Top: General Summary: Daily Summary: Hourly Summary: Domain Report: Organization Report: Operating System Report: Status Code Report: File Size Report: File Type Report: Directory Report: Request Report)
This report lists the extensions of files.

Listing extensions with at least 0.1% of the traffic, sorted by the amount of traffic.
#reqs: %bytes: extension
-----: ------: ---------
  997: 62.08%: .html [Hypertext Markup Language]
12214: 34.52%: .php  [PHP]
 1112:  1.43%: [directories]
  436:  0.76%: [no extension]
    5:  0.48%: .pdf  [Adobe Portable Document Format]
   60:  0.29%: .jpg  [JPEG graphics]
  101:  0.13%: .css  [Cascading Style Sheets]
   29:  0.13%: .htm  [Hypertext Markup Language]
  117:  0.19%: [not listed: 8 extensions]
(Go To: Top: General Summary: Daily Summary: Hourly Summary: Domain Report: Organization Report: Operating System Report: Status Code Report: File Size Report: File Type Report: Directory Report: Request Report)
This report lists the directories from which files were requested. (The figures for each directory include all of its subdirectories.)

Listing directories with at least 0.01% of the traffic, sorted by the amount of traffic.
#reqs: %bytes: directory
-----: ------: ---------
 1552: 62.13%: /priv_stats/
 4057: 10.84%: /archive_wags2.php/
 3259: 10.67%: /archive_dogma.php/
 2012:  5.15%: [root directory]
 1322:  3.64%: /archive_wags1.php/
  981:  2.58%: /archive_tricks.php/
  941:  2.01%: /archive_inner_dog.php/
    8:  0.71%: http://
  445:  0.64%: /fetch.php/
    3:  0.48%: /pdfs/
   57:  0.27%: /images/
  113:  0.16%: /about_us.php/
   40:  0.16%: /Old Site 08-15-05/
   53:  0.10%: /subscribe.php/
   65:  0.10%: /advertise.php/
   59:  0.10%: /archive.php/
   30:  0.09%: /cyberdog.php/
   23:  0.06%: /wags1.php/
   11:  0.04%: /current_issue.php/
   17:  0.03%: /distribution.php/
    7:  0.02%: /wags2.php/
   16:  0.02%: [not listed: 5 directories]
(Go To: Top: General Summary: Daily Summary: Hourly Summary: Domain Report: Organization Report: Operating System Report: Status Code Report: File Size Report: File Type Report: Directory Report: Request Report)
This report lists the files on the site.

Listing files with at least 20 requests, sorted by the number of requests.
#reqs: %bytes:          last time: file
-----: ------: ------------------: ----
  570:  2.13%: Jul/17/26 11:41 PM: /archive_dogma.php
  564:  0.78%: Jul/17/26 11:58 PM: /priv_stats/
  335:  2.58%: Jul/17/26  7:40 PM: /priv_stats/usage_202512.html
  217:  0.63%: Jul/17/26 11:35 PM: /archive_tricks.php
  210:  0.62%: Jul/17/26 11:54 PM: /archive_wags1.php
  205:  0.57%: Jul/17/26 11:41 PM: /archive_wags2.php
  192:  0.01%: Jul/17/26 11:47 PM: /
  186:  0.41%: Jul/17/26 11:59 PM: /archive_inner_dog.php
  124:  0.17%: Jul/17/26 11:51 PM: /contact_us.php
  120: 13.50%: Jul/17/26 11:44 PM: /priv_stats/usage_202606.html
  120:  0.22%: Jul/17/26 11:51 PM: /archive_wags2.php/blog/
   89:  9.00%: Jul/17/26 10:51 PM: /priv_stats/usage_202607.html
   60:  0.18%: Jul/17/26 11:13 AM: /archive_wags2.php/trackback/images/issue_images/images/index_slices/images/issue_images/index_slices/issue_images/archive_inner_dog.php
   56:  0.17%: Jul/17/26 11:13 AM: /archive_wags2.php/trackback/images/issue_images/images/index_slices/images/issue_images/index_slices/issue_images/archive_dog_eared.php
   56:  0.17%: Jul/17/26 11:14 AM: /archive_wags2.php/trackback/images/issue_images/images/index_slices/images/issue_images/index_slices/issue_images/archive_tricks.php
   54:  0.12%: Jul/17/26 11:40 PM: /archive_dog_eared.php
   54:  0.05%: Jul/17/26 11:47 PM: /urbandogmagazine.css
   48:  0.14%: Jul/17/26 11:14 AM: /archive_wags2.php/trackback/images/issue_images/images/index_slices/images/issue_images/index_slices/issue_images/archive_wags1.php
   36:  3.28%: Jul/17/26 11:22 PM: /priv_stats/usage_201502.html
   35:  0.10%: Jul/17/26 11:33 PM: /archive_wags2.php/archive_tricks.php
   34:  0.10%: Jul/17/26 11:36 PM: /archive_wags2.php/trackback/images/issue_images/archive_dogma.php
   33:  3.29%: Jul/17/26 11:51 PM: /priv_stats/usage_202303.html
   32:  0.09%: Jul/17/26  9:58 AM: /archive_tricks.php/trackback/images/images/index_slices/images/index_slices/images/index_slices/images/index_slices/images/archive_dogma.php
   31:  0.07%: Jul/17/26 11:50 PM: /archive_inner_dog.php/trackback/images/issue_images/images/issue_images/images/issue_images/archive_dogma.php
   28:  2.92%: Jul/17/26 10:58 PM: /priv_stats/usage_202107.html
   28:  0.09%: Jul/17/26 11:12 AM: /archive_tricks.php/trackback/images/images/issue_images/images/issue_images/issue_images/index_slices/index_slices/archive_wags2.php
   27:  0.08%: Jul/17/26  9:59 AM: /archive_wags2.php/blog/images/images/issue_images/images/issue_images/images/issue_images/archive_dog_eared.php
   26:  0.05%: Jul/17/26 10:19 PM: /dog_eared.php
   24:  0.07%: Jul/17/26 11:00 PM: /archive_tricks.php/trackback/images/issue_images/archive_dogma.php
   24:  2.22%: Jul/17/26  9:17 PM: /priv_stats/usage_201508.html
   24:  0.07%: Jul/17/26 10:42 PM: /archive_wags2.php/archive_dogma.php
   24:  0.07%: Jul/17/26 10:00 AM: /archive_wags2.php/blog/images/images/issue_images/images/issue_images/images/issue_images/archive_wags1.php
   23:  0.07%: Jul/17/26 10:21 PM: /archive_wags1.php/trackback/images/issue_images/archive_dogma.php
   22:  0.04%: Jul/17/26 11:40 PM: /archive_wags2.php/blog/images/images/issue_images/images/issue_images/images/issue_images/images/issue_images/images/issue_ima
   21:  2.25%: Jul/17/26 11:29 PM: /priv_stats/usage_202408.html
   21:  0.08%: Jul/17/26  8:41 PM: /archive_dogma.php/trackback/images/issue_images/archive_dogma.php
   21:  0.03%: Jul/17/26 11:49 PM: /about_us.php
   21:  0.06%: Jul/17/26 12:45 PM: /archive_tricks.php/trackback/archive_dogma.php
   21:  2.08%: Jul/17/26 11:13 PM: /priv_stats/usage_202210.html
   21:  0.06%: Jul/17/26  1:12 PM: /archive_wags2.php/blog/archive_dogma.php
   21:  0.06%: Jul/17/26 10:45 PM: /archive_wags2.php/archive_inner_dog.php
   20:  0.07%: Jul/17/26 11:48 PM: /archive_dogma.php/archive_dogma.php
   20:  0.08%: Jul/17/26 11:36 PM: /archive_dogma.php/administrator/archive_dogma.php
   20:  0.06%: Jul/17/26 10:03 PM: /archive_wags1.php/trackback/archive_dog_eared.php
   20:  0.08%: Jul/17/26  8:23 PM: /archive_dogma.php/administrator/images/index_slices/archive_dogma.php
   20:  0.08%: Jul/17/26 11:52 PM: /archive_dogma.php/administrator/images/index_slices/images/index_slices/images/issue_images/images/images/issue_images/archive_dogma.php
   20:  0.06%: Jul/17/26 10:20 PM: /archive_wags2.php/archive_wags1.php
11093: 50.91%: Jul/17/26 11:59 PM: [not listed: 4,758 files]
(Go To: Top: General Summary: Daily Summary: Hourly Summary: Domain Report: Organization Report: Operating System Report: Status Code Report: File Size Report: File Type Report: Directory Report: Request Report)


